Fora Financial, a small business lender, announced a new securitization for $127M.
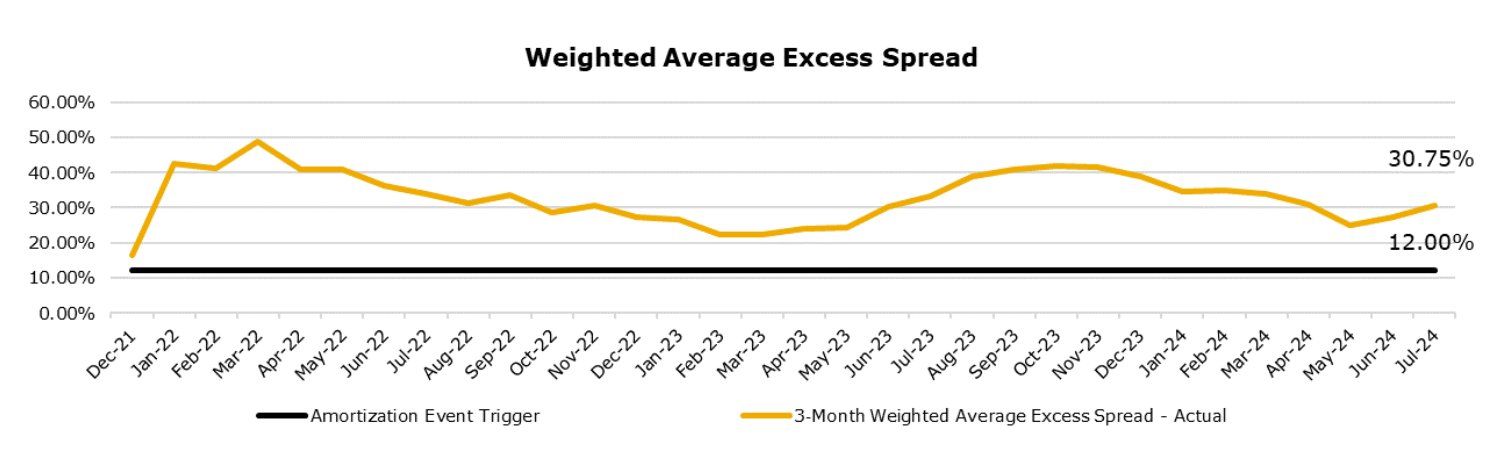
The transaction’s structure, including overcollateralization and excess spread for additional protection.
Quick overview of Fora Financial:
– Founded in 2008 by Jared Feldman and Daniel Smith
– Provides financing to small and medium-sized businesses
– Has funded over $4.0 billion to more than 35,000 Merchants
– Recently announced a $127.0 million securitization (FFAS 2024-1) backed by small business loans and merchant cash advances
Products:
1. Advance Receivables: Purchase of future receivables, not loans
– Daily or weekly remittances
– No fixed term, estimated collection period of 3-24 months
– Priced using a factor rate (RTR ratio)
2. Business Loans: Fixed-term loans up to 18 months
– Daily or weekly payments
– Fixed fee instead of interest rate
– Personal guarantee required
Underwriting Policy:
– Uses proprietary PRISM scoring model
– Considers 200+ data points from sources like Experian and LexisNexis
– Minimum criteria: 500 FICO, 6 months in business, $1,000 avg daily bank balance
– Manual adjustments possible for lower Credit Tiers
– Any application with PRISM score > 20 is declined.
Here’s how PRISM score is used across tiers.
– Tier 1: 0 – 4.99
– Tier 2: 5 – 9.9
– Tier 3: 10 – 14.99
– Tier 4: 15 – 19.99
– Tier 5: 20 – 24.99
– Tier 6: 25+
Portfolio:
The $132.4 million collateral pool consists of 2,326 receivables to 2,281 unique merchants.
Key metrics:
– Total receivables: 2,326
– Wtd avg RTR ratio: 1.34x
– Wtd avg FICO: 692
– Avg outstanding receivables balance: $56,925
– Wtd avg original term: 13.6 months
– Wtd avg remaining term: 9.2 months
– Top states: CA (13.86%), FL (10.20%), TX (9.92%)
Fora doesn’t charge based on traditional interest rate metrics. Instead, it uses a concept called “Calculated Receivables Yield” for pricing.
The weighted average excess spread is 30.75%.
This yield is calculated using:
– The expected collection period
– The funded amount
– The RTR (Return to Receivable) Amount
– Assuming no prepayments or defaults
– Assuming monthly scheduled payments are received at an 80% Performance Ratio
The weighted average Calculated Receivables Yield at origination for the Statistical Pool is 44.77%.
The receivables are to small businesses across various industries.
Distribution by Credit Tier:
– Tier 1: 22.53%
– Tier 2: 57.08%
– Tier 3: 18.16%
– Tier 4: 2.23%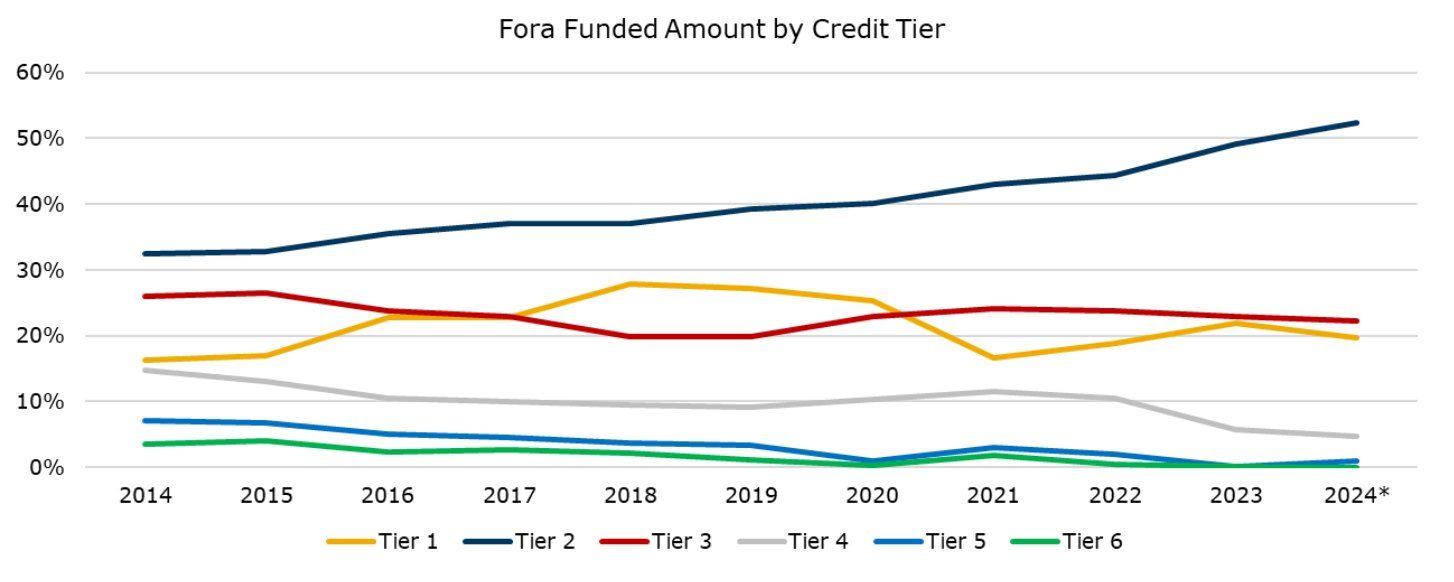
Growth:
Fora’s originations have grown from ~$60 million in 2021 to $379 million in 2023.
Product type breakdown:
– Advance Receivables: 56.64%
– Business Loans: 43.36%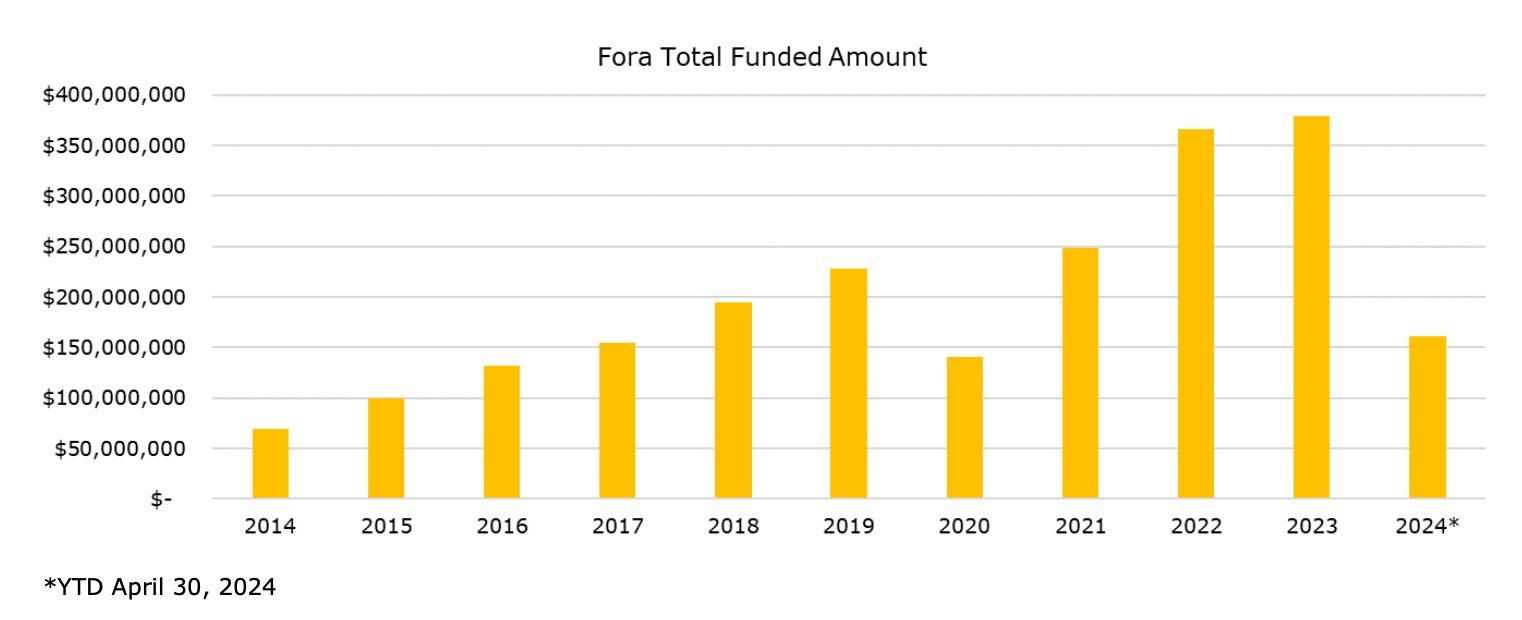
Servicing and Collections:
– Fora Financial Servicing LLC as the primary servicer
– Orion First Financial, LLC as backup servicer
– Collections primarily via ACH debits
– Servicing fee is not known but generally, it’s 2%-4%
The transaction features a 24-month revolving period and includes various rapid amortization triggers to protect investors.